


In many organizations, monitoring is still treated as a purely technical function: checking servers, tracking CPU, memory, and uptime. These signals are important, but they no longer reflect how modern digital products actually behave.
Today’s systems are not isolated services. They are distributed environments where value is created not at the infrastructure layer, but at the level of business processes and user journeys.
That changes the core question:
- not “Is the system running?”
- but “Is the business logic working as expected?”
Monitoring is no longer about isolated metrics. It is about understanding what is happening across the entire product — from infrastructure to business outcomes.
Instead of focusing on server health alone, monitoring now needs to reflect the full lifecycle of user actions.
Three Levels of Monitoring
A practical way to structure monitoring is through three interconnected layers:
1. Infrastructure Level
This is the foundation: servers, compute resources, and basic system health.
Typical signals include:
- CPU usage
- RAM consumption
- Disk usage
- Network throughput
- Uptime
This layer answers a simple question:
Is the system running at all?
But it does not answer whether the system is actually delivering value.
2. Platform Level
This layer covers the components that enable system logic and internal communication.
It includes:
- Databases (read/write performance, connections)
- Message queues (processing speed, backlog size)
- APIs and load balancers
- Service-to-service communication
Here, the focus shifts to system behavior:
- A queue backlog can indicate processing delays
- Slow database queries can increase latency
- API bottlenecks can degrade performance
This layer answers:
Are system components functioning correctly together?
However, it still does not directly explain business outcomes.
3. Business / Application Level
This is the most important and often the most overlooked layer.
It focuses on real business events:
- number of successful transactions
- orders completed per hour
- conversion rates
- time required for key user flows
- errors in specific user journeys
This layer answers the critical question:
Is the product delivering the intended business value?
In many organizations, this layer is missing entirely.
Why Infrastructure Metrics Are Not Enough
Consider a typical scenario:
- CPU is normal
- memory usage is stable
- servers are healthy
But users report that:
- payments are failing
- orders are not being completed
- processes are taking too long
From an infrastructure perspective, everything looks fine. From a business perspective, the system is failing.
This happens because infrastructure metrics do not correlate directly with business outcomes.
Without business-level monitoring:
- engineers spend hours investigating logs across multiple services
- issues are only discovered indirectly through user complaints
- bottlenecks remain hidden inside queues or service dependencies
A system can appear “green” while critical workflows are broken.
Monitoring Is Not Dashboards — It Is Process Understanding
Real monitoring is not defined by tools or dashboards. It starts with a different question:
Which business processes are critical to the product?
This is where complexity appears:
- every product has unique workflows
- processes are not standardized
- they must be explicitly defined and modeled
Monitoring becomes less about collecting data and more about understanding structure and behavior.
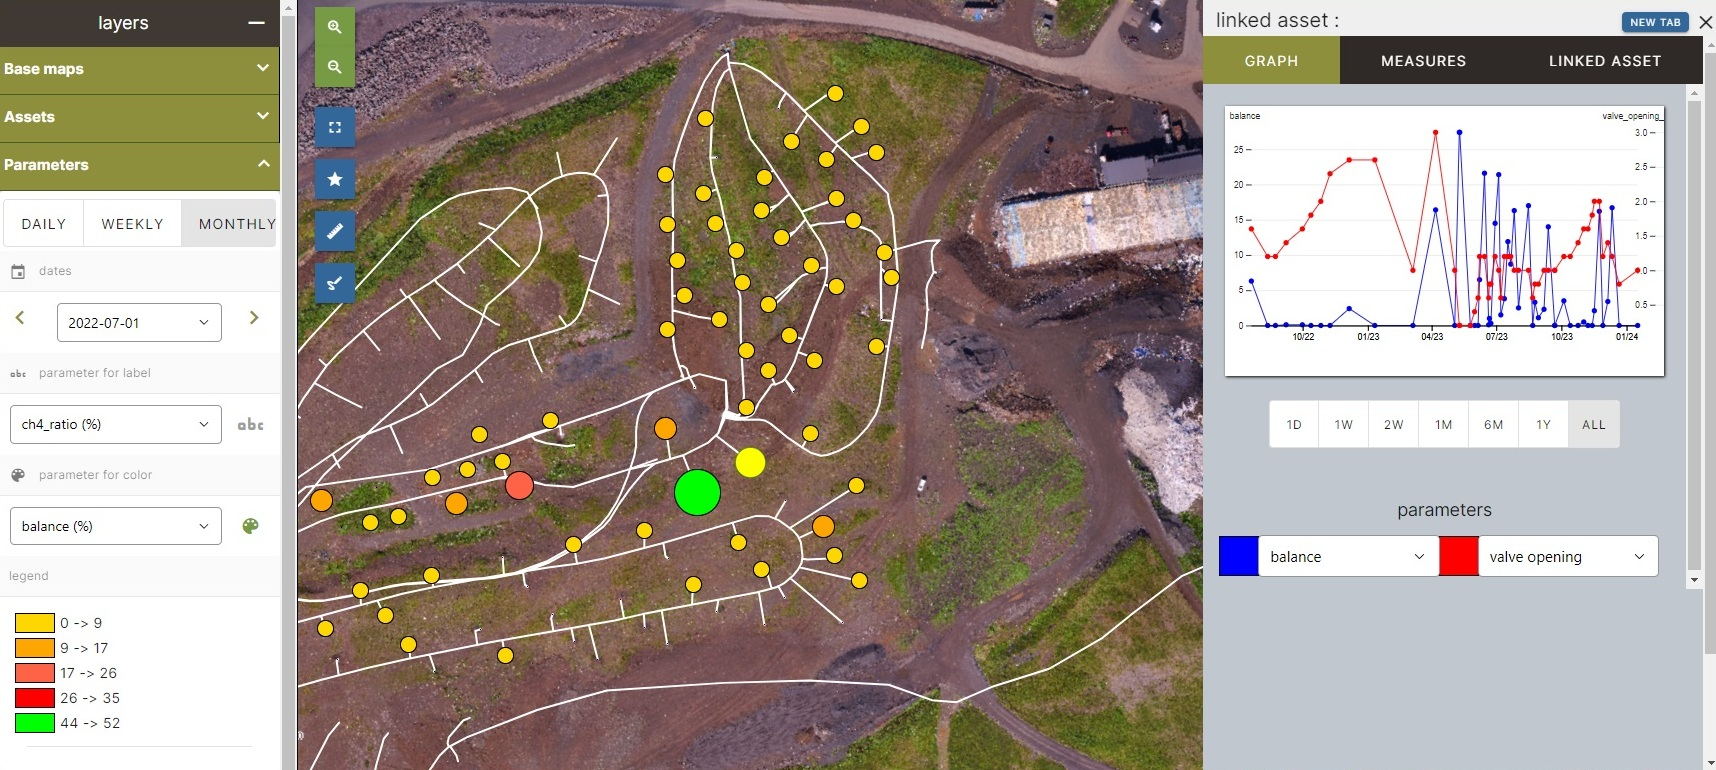
Case: Monitoring a Digital Landfill Platform
A strong example of process-centric monitoring comes from a platform developed for landfill management (elandfill.io by ReSource International). It is a complex system combining large-scale data processing, 3D modeling, and real-time geospatial analytics used to monitor landfill sites and estimate environmental impact such as methane emissions.
The Core Business Process
The main workflow looks like this:
- A drone captures landfill data
- A user uploads the dataset (2–10 GB per file)
- The system processes the file through multiple stages:
- ingestion
- compression
- transformation into a 3D model
- integration with geospatial data
- The result is visualized on a map for analysis
This is not a single operation. It is a chain of dependent steps, where each stage relies on the previous one.
System Architecture
The platform consists of:
- frontend interface
- backend services coordinating processing
- message queue for asynchronous tasks
- data processing services
- a dedicated 3D engine for heavy computation
The 3D engine is especially important:
- it is not always running
- it starts on demand
- it consumes significant CPU/GPU resources
- it shuts down after completing tasks
This makes the system dynamic and resource-sensitive.
Why Traditional Monitoring Fails Here
From a classic monitoring perspective, everything may look fine:
- servers are healthy
- CPU and memory are within limits
- services are operational
Yet the business process may still fail:
- files are stuck in queues
- processing stops mid-pipeline
- operations take 20 minutes instead of 5
Infrastructure monitoring does not reveal where or why the process breaks.
A Process-Centric Monitoring Approach
The solution was to shift focus from infrastructure monitoring to process monitoring.
A unified observability layer was introduced, tracking the full lifecycle of each task.
A central dashboard provides:
- status of all services
- application versions
- “last seen” activity per component
- stage-by-stage processing status
- execution time per step
- errors and bottlenecks
New services are automatically integrated into the monitoring system, enabling scalability without manual configuration.
Monitoring + Observability + Automation
To manage modern systems effectively, monitoring alone is not enough. A combined model is required:
1. Observability — understanding system behavior
Collecting and structuring data across the entire stack, from UI to backend and processing layers.
2. Monitoring — tracking system state
Focusing on:
- execution time of processes
- service health
- resource utilization
3. Alerting — detecting anomalies
Automated notifications for:
- CPU or memory spikes
- processing delays
- service failures
Alerts are integrated with collaboration tools such as Microsoft Teams for fast response.
4. Automation — system response
The system does not only report issues but reacts to them:
- auto-scaling under load
- service restarts after failure
- script execution for recovery
This moves monitoring toward self-healing infrastructure.
Business Impact
This approach delivers outcomes far beyond technical stability:
1. Full visibility
The entire process — from data upload to final result — is visible in one system.
2. Faster diagnostics
Teams no longer search across services; they immediately see where the failure occurred.
3. SLA control
Clear performance expectations can be defined for each stage:
- compression time thresholds
- processing duration limits
4. Cost optimization
Resource-heavy components run only when needed, reducing waste.
Key Transformation
This case illustrates a fundamental shift:
Monitoring stops being a technical utility and becomes a tool for managing business processes.
As a result, the platform was able to scale across multiple European countries, while also supporting environmental decision-making such as:
- methane emission forecasting
- waste management optimization
- regulatory compliance support
Conclusion
Monitoring is not about collecting logs or building dashboards. It is about creating a structured view of how a system actually behaves in relation to business outcomes.
Infrastructure metrics alone cannot explain whether users are achieving their goals. A system can look stable while critical workflows silently fail.
Value appears when monitoring is connected to real processes:
- data upload
- transaction execution
- workflow completion
At that point, monitoring shifts from a set of technical signals into a system-level understanding of how a product truly operates.